



A body composition analysis report can contain dozens of numbers, charts, reference ranges, and body-segment diagrams. For first-time users, the amount of information can make the report look more complicated than it really is.
The biggest mistake is trying to interpret every number independently.
A professional should instead read the report as a connected story:
Body weight → fat and lean mass → muscle distribution → body water → regional balance → historical trend.
This approach matters for gyms, nutrition centers, rehabilitation facilities, health management centers, wellness programs, and other organizations using body composition assessment as part of an ongoing service.
A useful body composition analysis report should help answer four practical questions:
- What is the body made of?
- Where are muscle and fat distributed?
- Are there meaningful left-to-right or upper-to-lower differences?
- Is the person’s composition changing over time?
This guide explains how to interpret the most important sections of a professional report without treating every displayed value as a diagnosis.
Table of Contents
What Does a Body Composition Analysis Report Actually Show?

Body weight alone does not explain what caused weight to increase or decrease.
Two people can have the same weight and height while having substantially different amounts of:
- Fat mass
- Skeletal muscle
- Body water
- Fat-free mass
- Regional muscle
- Regional fat
That is why body composition assessment can provide more context than a conventional scale.
Bioelectrical impedance analysis, commonly known as BIA, estimates body composition by measuring the body’s opposition to a low-level alternating electrical current. Water-rich tissues conduct electrical current differently from tissues containing less water.
A scientific review hosted by the U.S. National Library of Medicine explains that BIA uses impedance measurements to estimate total body water and derive estimates of fat-free mass and other body composition values. Read the NCBI overview of body composition assessment
A body composition analysis report may include:
| Report Metric | What It Helps Describe |
|---|---|
| Body Weight | Total measured body mass |
| BMI | Weight relative to height |
| Body Fat Percentage | Estimated proportion of weight represented by fat |
| Body Fat Mass | Estimated total mass of fat |
| Skeletal Muscle Mass | Estimated muscle associated with movement and physical function |
| Fat-Free Mass | Everything other than estimated fat mass |
| Total Body Water | Estimated water within the body |
| Segmental Muscle | Estimated muscle distribution by body region |
| Segmental Fat | Estimated fat distribution by body region |
| Visceral Fat Indicator | An estimate related to abdominal internal fat |
| Basal Metabolic Rate | Estimated baseline energy requirement |
| Body Balance Data | Comparison between different body segments |
| Historical Trend | Changes between repeated measurements |
Not every analyzer reports the same metrics, and similarly named metrics may be calculated differently.
This is why the first rule of report interpretation is simple:
Understand what the device measures directly and what the software estimates.
Read a Body Composition Analysis Report in This Order
Rather than starting with whichever number looks highest or lowest, use a consistent interpretation sequence.
Step 1: Confirm the Basic Test Information
Before interpreting the result, check:
- User identity
- Age
- Sex
- Height
- Test date
- Test time
- Measurement unit
- Previous testing conditions
Incorrect profile information can affect calculated values.
You should also ask whether today’s test conditions were similar to previous tests.
Recent exercise, unusual fluid intake, a large meal, dehydration, or testing at a different time of day may make two reports less comparable.
Step 2: Look at Weight, Fat Mass, and Muscle Together
Never interpret body weight by itself.
Consider these metrics together:
Weight + body fat mass + skeletal muscle mass
For example, a person’s weight could remain unchanged while body fat decreases and muscle increases.
A scale would show “no progress.”
A body composition analysis report may show meaningful recomposition.
Step 3: Review Body Fat Percentage
Next, examine the proportion of total weight estimated to come from fat.
Do not immediately label the person based on one number.
Consider:
- Age
- Sex
- Fitness status
- Measurement conditions
- Historical results
- Professional context
Step 4: Review Muscle Distribution
After total muscle, move to segmental data.
Ask:
- Are the legs reasonably balanced?
- Are the arms reasonably balanced?
- Is one side changing differently from the other?
- Is the imbalance stable or increasing?
Step 5: Check Water-Related Metrics
Unexpected changes in body water can help explain why muscle or fat estimates suddenly moved.
Step 6: Review the Trend
The last step is often the most valuable:
Compare the current result with previous standardized tests.
A single report is a snapshot.
Several comparable reports form a trend.
Body Weight and BMI: Useful, but Not the Whole Story
Body weight is usually the first number users notice.
It is also one of the easiest numbers to misunderstand.
Weight includes:
- Fat
- Muscle
- Water
- Bone
- Organs
- Other tissues
A person who gains muscle and loses fat may see little change in total weight.
This is one reason a body composition analysis report can provide more context than weight alone.
How Should BMI Be Used?
Body mass index compares body weight with height.
BMI remains useful as a screening tool, particularly for population-level and general weight classification.
However, the U.S. Centers for Disease Control and Prevention notes that BMI does not directly measure body fat and does not distinguish between fat, muscle, and bone mass. See the CDC explanation of BMI
For a gym member with substantial muscle mass, BMI may therefore tell only part of the story.
For commercial body assessment, it is usually better to view BMI alongside:
- Body fat percentage
- Fat mass
- Skeletal muscle
- Fat-free mass
- Waist or circumference information
- Historical change
A Better Question Than “Is My BMI Good?”
Instead ask:
“What combination of muscle, fat, and weight produced this BMI?”
That question turns a simple screening number into a more useful conversation.
How to Interpret Body Fat Percentage and Body Fat Mass
These two values are related but not identical.
Body Fat Percentage
Body fat percentage represents estimated fat mass as a proportion of total body weight.
Body Fat Mass
Body fat mass expresses estimated fat as an absolute mass.
Suppose someone loses weight.
If the body composition analysis report shows that most of the reduction came from fat mass while skeletal muscle remained relatively stable, the result tells a very different story from weight loss accompanied by substantial lean mass reduction.
This distinction can be important in:
- Fitness programs
- Nutrition interventions
- Weight management
- Sports conditioning
- Long-term wellness monitoring
Why Percentage Alone Can Be Misleading
Imagine skeletal muscle increases while fat mass remains approximately stable.
The person’s body fat percentage may decrease because total composition changed.
Now consider the opposite situation.
A person loses significant muscle while fat mass changes very little. Body fat percentage can rise even without gaining substantial fat.
The correct interpretation therefore requires both:
relative values + absolute values
Do not focus on percentage alone.
Skeletal Muscle Mass: One of the Most Useful Trend Metrics
Skeletal muscle is highly relevant to physical performance, mobility, training, and body composition goals.
A professional body composition analysis report often estimates skeletal muscle separately from total fat-free mass.
These numbers should not automatically be treated as interchangeable.
Fat-free mass may contain:
- Muscle
- Water
- Bone-related components
- Other non-fat tissues
Skeletal muscle is a more specific estimate.
What Should Trainers Look For?
Instead of asking only whether skeletal muscle is “high” or “low,” ask:
- Is muscle changing in the intended direction?
- Is change occurring in both upper and lower body?
- Is muscle being preserved during weight reduction?
- Are left and right sides reasonably balanced?
- Are the results consistent across several tests?
This turns the report into a coaching tool rather than a scoreboard.
Why Trend Matters More Than a Single Result
Imagine the following testing sequence:
| Test | Weight | Skeletal Muscle | Body Fat Mass |
| Baseline | Stable | Baseline | Baseline |
| Month 1 | Slight decrease | Stable | Decrease |
| Month 2 | Similar | Increase | Further decrease |
| Month 3 | Slight increase | Further increase | Stable |
A conventional scale might make Month 3 look disappointing because weight increased.
The complete body composition analysis report suggests a very different interpretation.
That is the practical value of composition tracking.
Segmental Analysis: Look Beyond the Whole-Body Numbers
Whole-body values tell you how much muscle or fat is estimated overall.
Segmental analysis attempts to show where it is distributed.
Professional systems may divide results into:
- Left arm
- Right arm
- Trunk
- Left leg
- Right leg
A multi-frequency, eight-contact system can use separate hand and foot pathways to support regional analysis.
For organizations requiring this type of assessment, the LW-870 body segmental analyzer uses eight contact electrodes and multiple measurement frequencies while combining segmental body composition with additional body assessment functions.
What Does Left-Right Difference Mean?
A difference between limbs does not automatically indicate a problem.
Potential explanations include:
- Natural dominance
- Sport-specific training
- Previous injury
- Different loading patterns
- Rehabilitation status
- Measurement variation
- Positioning differences
The most useful question is often:
“Is the asymmetry changing?”
A stable small difference may tell a different story from a difference that becomes progressively larger.
Example: Rehabilitation Monitoring
Imagine the right leg consistently shows less estimated muscle than the left leg.
After several weeks of rehabilitation, the body composition analysis report shows:
- The right leg increasing
- The left leg remaining stable
- The difference becoming smaller
That trend may be more useful than comparing the patient’s total weight between the first and final visit.
Example: Strength Training
A client may gain total muscle while most improvement occurs in the upper body.
Segmental analysis can help identify whether the training result matches the intended program.
For a deeper explanation of this technology, see the segmental body composition analyzer guide.
Body Water: The Metric People Commonly Ignore

Body water is one of the most important contextual variables in BIA.
It is also frequently overlooked.
Because BIA depends on electrical behavior in water-containing tissues, fluid status can influence estimated body composition.
A newer scientific review emphasizes that measurement quality, standardization, interpretation, and measurement uncertainty all matter when BIA data are used in professional workflows. Read the recent scientific review of BIA measurement quality
Why Water Can Change Quickly
Body water can vary because of:
- Food intake
- Fluid intake
- Exercise
- Sweating
- Temperature
- Travel
- Menstrual cycle
- Illness
- Salt intake
- Recovery status
Muscle and fat do not usually change dramatically in a few hours.
Water can.
Therefore, when a body composition analysis report shows an unexpectedly large short-term shift, first ask whether measurement conditions were comparable.
Total Body Water
Total body water provides an overall estimate of water contained in the body.
More advanced multi-frequency systems may provide additional information intended to differentiate fluid compartments.
Scientific literature notes that multi-frequency BIA can provide more information about total, intracellular, and extracellular water than conventional single-frequency approaches. Review the scientific overview of multi-frequency BIA
For routine commercial use, these metrics are most useful when operators understand their limitations and compare them under standardized conditions.
Visceral Fat: Read It as an Estimate, Not a Direct Image
Many professional reports include a visceral fat level, rating, index, or estimated area.
This is frequently one of the numbers users care about most.
However, it is important to understand what the report is doing.
A BIA analyzer does not create a medical image of abdominal fat.
Instead, visceral fat-related results are usually algorithm-based estimates derived from body measurements and impedance-related data.
Therefore, operators should avoid saying:
“The machine directly saw your visceral fat.”
A more accurate explanation is:
“The system estimates a visceral-fat-related value from the measurement data.”
Why This Matters
Clear language protects both the user and the organization.
A body composition analysis report can help monitor changes, but estimated visceral fat should not automatically be presented as a standalone diagnosis.
When large changes appear between tests, check:
- Weight change
- Body fat mass
- Hydration
- Testing conditions
- Waist or circumference trends
- Longer-term history
The relationship between multiple metrics is usually more informative than one isolated score.
Basal Metabolic Rate: Useful Estimate, Not a Calorie Prescription
Basal metabolic rate, commonly abbreviated BMR, estimates the energy required to maintain essential body functions at rest.
Professional reports may calculate BMR using variables such as:
- Body composition
- Weight
- Height
- Age
- Sex
The key word is estimate.
A BMR value should not automatically become a person’s daily calorie target.
Actual energy requirements also depend on:
- Physical activity
- Occupation
- Training
- Daily movement
- Goals
- Health status
- Individual physiology
When explaining the body composition analysis report, use BMR as contextual information rather than presenting it as an exact daily eating recommendation.
This distinction makes the report more professional and reduces the risk of overinterpreting calculated values.
How to Read a Body Composition Analysis Report for Different Goals
A useful interpretation depends on what the person is trying to achieve.
The same report can tell different stories for different users.
Fat-Loss Program
Prioritize:
- Body fat mass
- Body fat percentage
- Skeletal muscle preservation
- Segmental muscle
- Weight
- Long-term trend
Do not celebrate weight loss automatically.
Ask whether the desired tissue changed.
Muscle-Gain Program
Prioritize:
- Skeletal muscle mass
- Segmental muscle
- Fat mass
- Body weight
- Left-right balance
- Historical trend
An increase in weight may be expected, but the report helps determine what contributed to that increase.
Rehabilitation Program
Prioritize:
- Segmental muscle
- Left-right differences
- Lower- or upper-limb trend
- Body water context
- Overall muscle
- Additional functional assessment where available
For projects that combine body composition with physical-function and balance evaluation, facilities can review the broader commercial body analyzer range to compare different assessment configurations.
Wellness or Body-Shaping Program
Prioritize:
- Body fat
- Skeletal muscle
- Circumference
- Segmental fat
- Body shape
- Posture
- Historical visual change
In this environment, combining internal composition estimates with external body-shape information can provide a more intuitive progress story.
Systems designed for multidimensional assessment may combine BIA with optical body scanning and circumference measurement. The LW-880 body analysis system is an example of this type of broader assessment workflow.
What Changes Between Two Reports Actually Matter?
This is one of the most valuable questions a professional can ask.
Not every change deserves interpretation.
Suppose a body composition analysis report changes slightly from yesterday.
That difference could reflect:
- Normal biological variation
- Hydration
- Food
- Exercise
- Test timing
- User positioning
- Electrode contact
Now suppose the same directional change appears across four standardized monthly tests.
That is much more interesting.
Use the Three-Test Rule
Before making a strong conclusion from a small change, review:
Previous test → current test → next test
This helps distinguish a trend from noise.
Look for Connected Changes
A result becomes more convincing when several related metrics move together.
For example:
More convincing fat-loss trend
- Body fat mass decreases
- Body fat percentage decreases
- Weight decreases moderately
- Skeletal muscle remains relatively stable
More convincing muscle-development trend
- Skeletal muscle increases
- Segmental muscle increases
- Body fat remains stable
- Weight increases slightly
Possible hydration-related fluctuation
- Body water changes sharply
- Muscle estimate changes suddenly
- Weight changes rapidly
- Results return toward baseline at the next test
A body composition analysis report becomes most valuable when metrics are interpreted as a system rather than as isolated numbers.
Five Mistakes That Make Reports Less Useful
Mistake 1: Testing Every Day and Reacting to Every Change
Body composition programs usually need enough time between measurements for meaningful changes to occur.
Overtesting may simply reveal daily fluid variation.
Mistake 2: Changing Testing Conditions
A morning fasted test should not be directly compared with a post-workout evening test without acknowledging the difference.
Consistency improves interpretability.
Mistake 3: Treating Every Number as Directly Measured
Professional reports often combine measured data with derived and estimated metrics.
Staff should know the difference.
Mistake 4: Comparing Results From Different Devices Without Context
Different systems can use different:
- Frequencies
- Electrode arrangements
- Equations
- Algorithms
- Reference ranges
A research comparison of standing BIA and DXA found that high measurement precision can coexist with systematic differences between methods. Read the study on BIA precision and systematic differences
This is another reason long-term monitoring should ideally use the same system and protocol.
Mistake 5: Turning a Screening Report Into a Diagnosis
A body composition analysis report can provide valuable assessment and trend information.
It should not be treated as a substitute for appropriate clinical evaluation.
The same principle applies to BMI. The CDC describes BMI as a screening measure that should be interpreted alongside other health information. See CDC guidance on BMI interpretation
How Gyms and Clinics Can Make Reports More Valuable to Clients
The value of a body composition system depends partly on how the organization uses the information after the test.
Printing a report and saying “here are your numbers” wastes much of its potential.
Build a Short Report Consultation
A practical consultation can follow this sequence:
1. Define the goal
“What are we trying to change?”
2. Review composition
“What are fat and muscle doing?”
3. Review distribution
“Where are those tissues distributed?”
4. Check context
“Could hydration or recent activity have affected today’s result?”
5. Compare history
“What changed from the previous standardized test?”
6. Agree on the next measurement date
“What interval gives enough time to detect meaningful progress?”
This workflow makes the body composition analysis report part of a professional service instead of simply an equipment output.
Avoid Information Overload
A report may contain dozens of metrics.
Most clients do not need a fifteen-minute explanation of every one.
Choose three to five measurements relevant to their goal.
For example:
Fitness member
- Skeletal muscle
- Body fat
- Segmental muscle
- Weight trend
Nutrition client
- Fat mass
- Body fat percentage
- Muscle preservation
- Weight trend
Rehabilitation client
- Segmental muscle
- Left-right comparison
- Body water context
- Functional measurements
The best report consultation is not necessarily the longest.
It is the one that turns measurements into understandable next steps.
What Commercial Buyers Should Check in the Reporting System
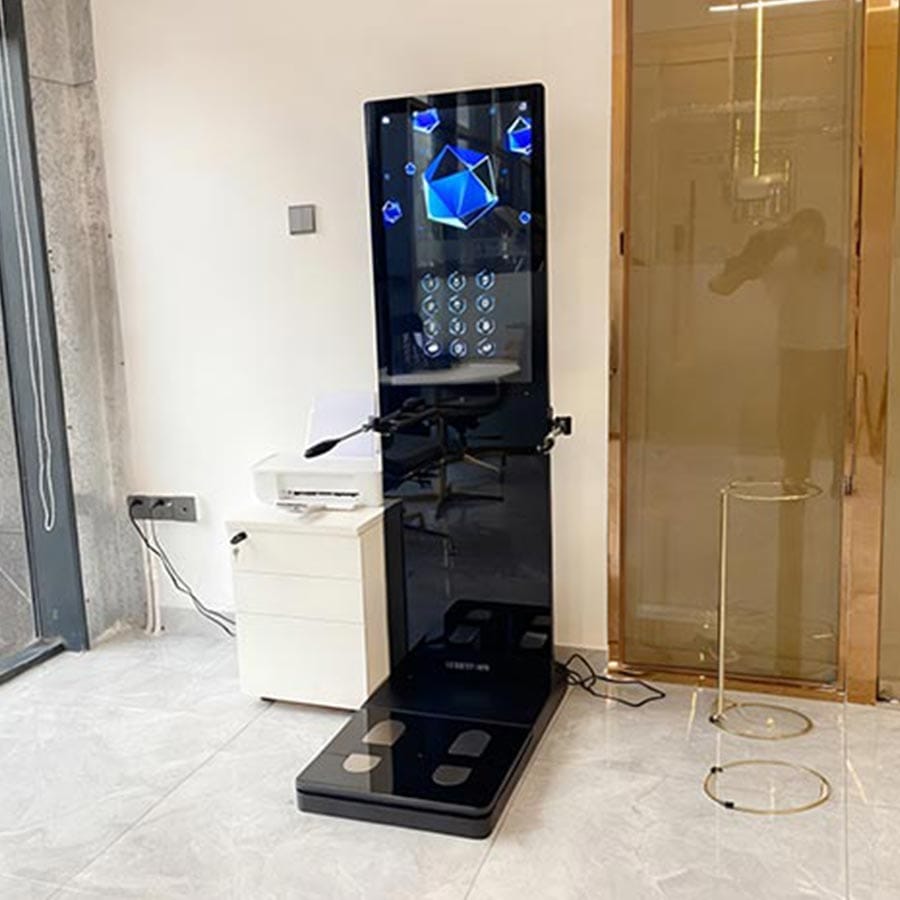
Organizations purchasing a body analyzer should evaluate more than the measurement hardware.
The reporting system influences how useful the equipment will be every day.
Before selecting a system, test the following.
| Reporting Function | What to Verify |
| User Profiles | Can repeat users be identified reliably? |
| Historical Trends | Can previous results be compared clearly? |
| Segmental Data | Are arms, legs, and trunk easy to interpret? |
| Report Export | Can results be printed or shared digitally? |
| Data Storage | Can reports be backed up and retrieved? |
| Multi-Location Use | Can authorized staff access appropriate records? |
| Language | Can reports match the target market? |
| Branding | Can professional projects customize report identity where required? |
| Permissions | Can access be controlled by role? |
| Original Data | Are historical records preserved accurately? |
A technically capable device may still create operational problems if:
- Reports are difficult to explain
- Historical results are hard to find
- Client profiles are duplicated
- Data cannot be exported
- Different locations use inconsistent settings
For distributors, fitness chains, clinics, or custom projects, reporting workflow should therefore be evaluated during the purchasing process.
Organizations requiring model selection, report customization, data management, or project-specific configuration can contact the technical team for a body analyzer solution.
FAQ
What is the most important number on a body composition analysis report?
There is no single most important number for every user.
For fat-loss programs, fat mass and muscle preservation may matter most. For strength programs, skeletal and segmental muscle may be more important. Rehabilitation programs may focus more heavily on regional differences.
The most useful metric depends on the goal.
Is body fat percentage more important than body weight?
They answer different questions.
Weight tells you total body mass. Body fat percentage estimates how much of that total is fat.
It is usually better to interpret both alongside fat mass and skeletal muscle.
Why did my muscle mass change overnight?
Real tissue change is unlikely to explain a large overnight difference.
Fluid status, food intake, exercise, test timing, positioning, or other measurement conditions may contribute.
Repeat the test under standardized conditions before drawing conclusions.
What does segmental muscle analysis mean?
Segmental analysis estimates muscle distribution separately in different regions such as the arms, legs, and trunk.
It can help users observe asymmetry and regional change over time.
Is visceral fat directly measured?
In BIA-based systems, visceral-fat-related values are generally estimates produced from measurement data and algorithms rather than direct medical imaging.
Operators should communicate this distinction clearly.
Why is BMI still included in the report?
BMI remains a simple screening measurement of weight relative to height.
However, it does not distinguish muscle, fat, and bone, so a body composition analysis report provides additional context.
How often should body composition be measured?
The ideal interval depends on the program and expected rate of change.
In many progress-monitoring situations, consistent testing conditions are more important than very frequent testing.
Should I compare results from two different machines?
Use caution.
Different analyzers may use different technologies, equations, frequencies, electrodes, and reference systems.
For trend monitoring, using the same analyzer and standardized protocol generally produces a more interpretable history.
Can a body composition analysis report diagnose a health condition?
A professional report can support screening, monitoring, fitness assessment, wellness programs, and professional evaluation within the intended use of the equipment.
It should not automatically be treated as a standalone medical diagnosis.
Conclusion
A body composition analysis report becomes valuable when users stop asking, “Is this number good or bad?” and start asking better questions.
What changed?
What caused the change?
Where did the change occur?
Was the test performed under comparable conditions?
Does the same pattern appear over several measurements?
The most useful interpretation usually follows this sequence:
weight → fat → muscle → segmental distribution → water → trend
Body weight provides the starting point.
Fat and skeletal muscle explain more of the composition.
Segmental measurements show where changes may be occurring.
Body water provides important context.
Historical testing shows whether the result is part of a real trend.
For gyms, nutrition facilities, rehabilitation centers, wellness programs, and health management organizations, this approach turns a body composition analysis report from a complicated sheet of numbers into a practical communication and progress-monitoring tool.
The goal should not be to make every client understand every metric.
The goal is to identify the measurements that matter for that person’s objective, test consistently, communicate limitations honestly, and use repeated reports to make progress easier to see.