

Table of Contents
Introduction
You’ve probably stepped on a scale and checked the number, only to wonder why it doesn’t seem to match how you look or feel. That’s because the scale only measures weight—not what that weight is made of. A digital body composition analyzer changes everything by revealing what your body is composed of—fat, muscle, water, and more.
In this comprehensive guide, you’ll learn what body composition is, why it matters, how digital analyzers work, real-world application examples, how to interpret data, mistakes to avoid, and actionable strategies to improve your body composition. Whether you’re an athlete, a health enthusiast, or someone looking to improve wellness, this guide will give you true insight into your body beyond mere weight.
What Is Body Composition?
Body composition refers to the relative proportions of different components in the body, primarily:
- Body fat
- Lean muscle mass
- Bone mass
- Total body water
Unlike a regular scale, which only tells you how much you weigh, body composition analysis reveals what makes up that weight. That is invaluable because two people with the same weight can have very different health profiles depending on how much muscle and fat they carry.
According to the American Council on Exercise, body fat percentage is a much better indicator of health risk compared to weight alone. For example, high body fat is linked with increased risk of heart disease, diabetes, and metabolic syndrome.
How Digital Body Composition Analyzers Work
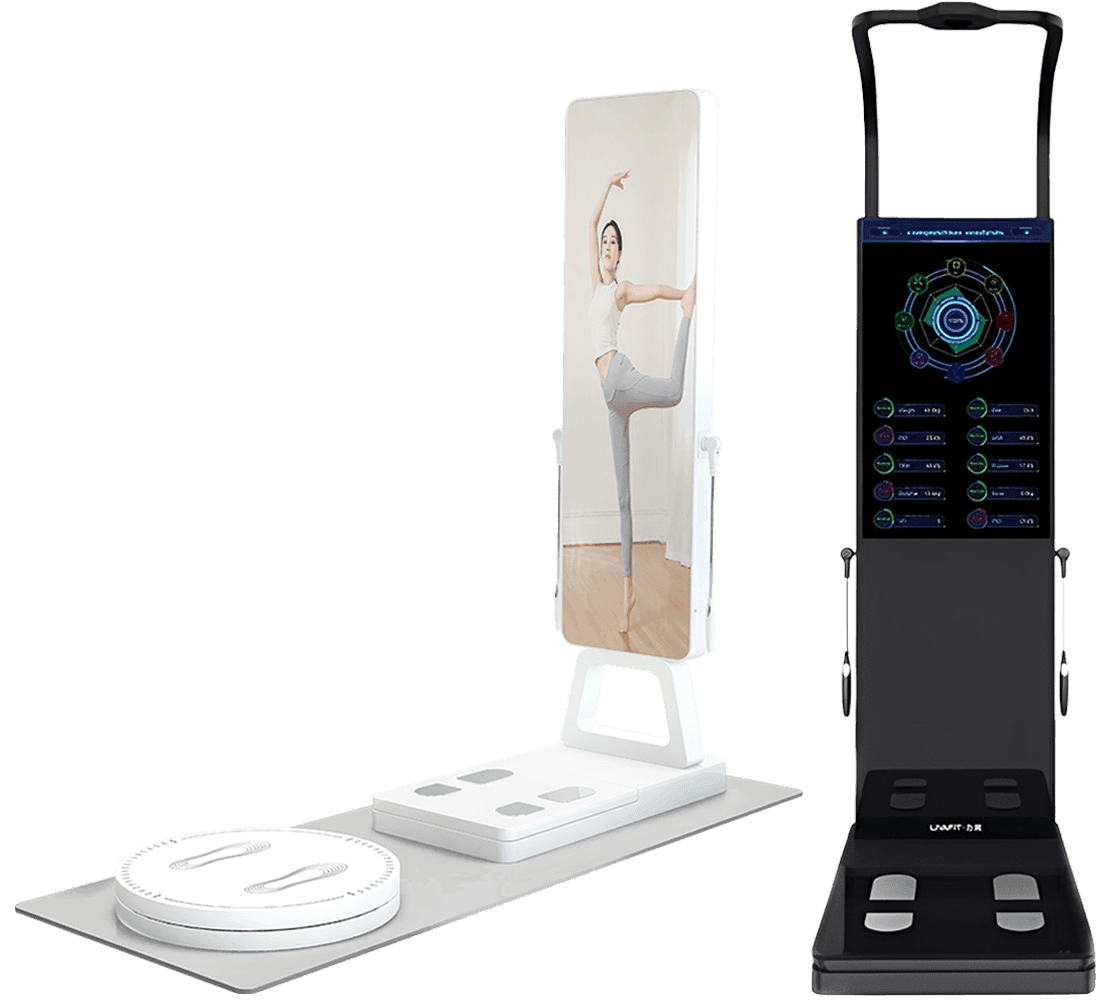
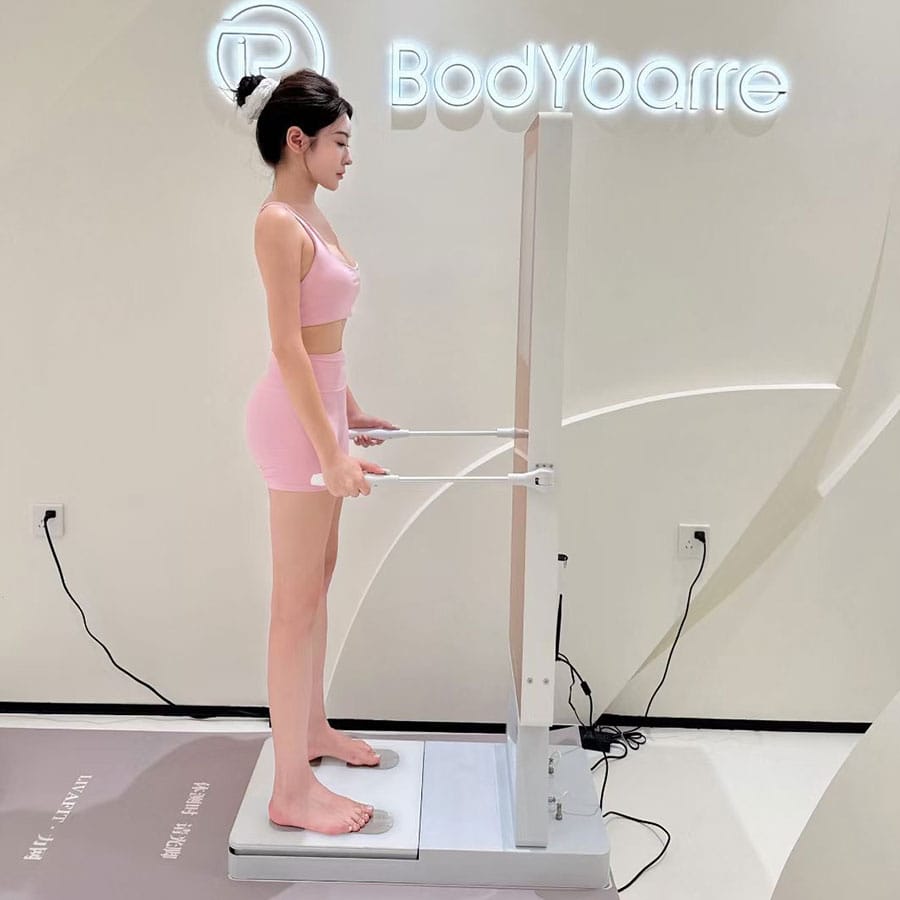
A digital body composition analyzer typically uses bioelectrical impedance analysis (BIA) to estimate body composition. Here’s how it works:
- You stand on the analyzer, holding sensors or placing feet on electrodes.
- A harmless electrical signal passes through your body.
- Because different tissues (fat, muscle, water) conduct electricity differently, the device estimates your body composition based on resistance.
This method is fast, non-invasive, and widely used in both clinical and consumer health environments.
However, it’s important to understand the limitations: hydration levels, recent food intake, and even skin temperature can influence readings. That’s why consistency in measurement conditions matters.
For a deeper look at the science behind it, see this overview from the Journal of Obesity: Bioelectrical Impedance Analysis for Body Composition.
Key Metrics Reported by Body Composition Analyzers

Digital analyzers typically provide a range of metrics. Here’s a breakdown of what they mean and why they matter:
| Metric | What It Means | Why It Matters |
|---|---|---|
| Body Fat Percentage | Proportion of your body that is fat | High levels can indicate health risks |
| Lean Body Mass | Muscle, organs, bones, water | Higher muscle mass supports metabolism |
| Visceral Fat | Fat around organs | Linked to chronic disease risk |
| BMI | Weight relative to height | General health estimate but limited accuracy |
| Basal Metabolic Rate (BMR) | Calories needed at rest | Useful for diet planning |
| Total Body Water | Amount of water in body | Hydration indicator |
Each of these metrics gives you a piece of the big picture, painting a more complete health profile than weight alone.
Real-Life Example: How Analysis Changed a Fitness Plan
Case Study: John’s Transformation
Background:
John, a 35-year-old office worker, weighed 180 lbs. His doctor said he was “normal weight”—but John felt sluggish and had low energy.
Initial Analysis:
Using a digital body composition analyzer, John discovered that he had:
- 28% body fat (higher than optimal for his age)
- Low lean muscle mass
- Below-average total body water levels
Despite a “normal” weight, his high body fat percentage indicated a need for change.
Action Plan:
- Increase protein intake to support muscle gain
- Implement strength training 3–4 times per week
- Hydrate consistently
- Track progress weekly using the analyzer
Outcome (12 Weeks):
- Body fat reduced to 22%
- Lean muscle mass increased
- John felt more energetic and stronger
This case highlights how body composition insights lead to smarter decisions compared to weight alone. By targeting muscle gain and fat loss directly, John improved both appearance and health markers.
How to Use a Digital Body Composition Analyzer Correctly
To get the most accurate results:
Measure at the Same Time of Day
Perform measurements first thing in the morning before eating or drinking.
Stay Consistent with Hydration
Hydration affects electrical conductivity. Drink a consistent amount of water daily.
Avoid Exercise Right Before Measurement
Physical activity can temporarily alter readings.
Wear Minimal Clothing
Metal or thick fabrics can interfere with the device.
Track Trends, Not Single Values
Daily fluctuations are normal. Focus on long-term trends.
By following consistent conditions, your data becomes more reliable and much more actionable.
Interpreting Your Results: What’s Good, What’s Not
There’s no one-size-fits-all ideal body composition, but general ranges are well-established for health guidance:
| Category | Men | Women |
|---|---|---|
| Essential Fat | 2–5% | 10–13% |
| Athletes | 6–13% | 14–20% |
| Fitness | 14–17% | 21–24% |
| Average | 18–24% | 25–31% |
| Obesity | 25%+ | 32%+ |
(Source: American Council on Exercise) ACE Body Fat Categories
These ranges provide context so you can evaluate where you stand relative to health and performance goals.
Body Composition vs. BMI: Why the Former Is Better
Most health assessments still reference Body Mass Index (BMI), a ratio of height to weight. But BMI tells you nothing about your actual body composition. For example:
- A muscular athlete might have a high BMI but low body fat.
- A sedentary person with high body fat might have a “normal” BMI.
This makes BMI a poor predictor of health outcomes compared with direct body composition analysis. Learn more at the Harvard Health Publishing overview
Advanced Insights: Visceral Fat and Metabolic Health
What Is Visceral Fat?
Visceral fat is the fat stored deep around your organs, as opposed to subcutaneous fat found under the skin. It’s more metabolically active and linked to higher risks of:
- Heart disease
- Insulin resistance
- Type 2 diabetes
Digital analyzers estimate visceral fat levels, giving you insight into risk factors that traditional scales completely miss.
Example: Maria’s Health Revelation
Maria, a 42-year-old with normal weight, discovered high visceral fat despite having a modest bodyweight. Her doctor used this data to adjust her nutrition and activity schedule, focusing on high-intensity interval training (HIIT) and fiber-rich nutrition.
Within 10 weeks, her visceral fat estimate improved, reducing long-term risk factors.
Practical Strategies to Improve Your Body Composition
You now have the data—here’s how to take action:
Strength Training
Prioritize resistance exercises to build lean muscle. Muscle burns more calories at rest, which helps with fat loss.
Protein-Rich Diet
Protein supports muscle repair and growth. Aim for at least 1.2–1.6 g/kg of body weight per day, adjusted to your goals.
Hydration
Drink water consistently throughout the day. Hydration improves exercise performance and analyzer accuracy.
Consistent Tracking
Use your digital analyzer once a week under consistent conditions to monitor trends.
Quality Sleep
Poor sleep increases stress hormones like cortisol, which can increase fat storage.
Common Pitfalls and How to Avoid Them
Even with great technology, mistakes happen.
| Pitfall | Mistake | Solution |
|---|---|---|
| Inconsistent Timing | Measuring at random times | Measure at the same time daily |
| Ignoring Hydration | Drinking uneven amounts | Keep water intake consistent |
| Expecting Overnight Results | Looking for instant changes | Focus on weekly/monthly trends |
| Misinterpreting Data | Not understanding metrics | Educate yourself on what each metric means |
By avoiding these common mistakes, you make your body composition data more useful and actionable.
Example Weekly Tracking Template

Below is a simple template you can use:
| Week | Body Weight | Body Fat % | Lean Mass | Visceral Fat | Notes |
|---|---|---|---|---|---|
| 1 | 180 | 28% | 129 lbs | 12 | Baseline |
| 2 | 179 | 27.5% | 130 lbs | 11 | Increased water |
| 3 | 178 | 26% | 131 lbs | 10 | Added strength training |
This kind of structured tracking helps you see real progress and adjust your plan.
Conclusion
You’ve learned why body composition matters, how a digital body composition analyzer works, how to get accurate measurements, how to interpret the data, and how to act on it. This knowledge gives you a roadmap to improve health, refine fitness strategies, and make data-informed decisions.
If you’re ready to move beyond the scale and truly understand your body, incorporating body composition analysis into your wellness routine can be a transformative step forward.
FAQ
How often should I measure my body composition?
Once a week under consistent conditions is ideal. Daily measurements can fluctuate too much due to hydration and food intake.
Can I rely on a home digital body composition analyzer?
Yes, especially for trends. While clinical tools like DEXA scans are more precise, home analyzers provide valuable insights when used consistently.
Why did my body fat percentage change overnight?
Temporary changes in hydration, sodium intake, or exercise can affect electrical impedance readings.
Is body composition more important than weight?
In most cases, yes. Body composition shows what your weight is actually made of—fat vs. muscle—offering much clearer health insights.
Can body composition analyzers be used for kids?
Some analyzers are validated for adolescent use, but it’s best to consult pediatric guidance.